


Last September, Steve Sailer examined the 2018 Crime Victimization Survey published by the Bureau of Justice Statistics of the Department of Justice. In November, the 2019 CVS was published, so I'm going to duplicate his results for interracial violent crime.
Here is the original data from table 15:

The "Asian" category has been eliminated entirely as a victim category; according to the notes, the "Other" victim category "includes Asians, Native Hawaiians and Other Pacific Islanders, American Indians and Alaska Natives, persons of two or more races, and multiple offenders of various races". I see from the "Highlights" section that Asians were 1% of perpetrators and 2.3% of victims; according to the text next to Table 9, the rate of Asian victimization fell by 50% from 2018 to 2019.

Here I multiplied out the percentages to get the raw numbers in each category, summed them by offender, and calculated the percent of the total for each offender category. Note that the percentage of violent crimes committed by blacks and Hispanics rose substantially. Blacks, at 12% of the population, committed 20% of the violent crimes in 2018 and 26% in 2019. Hispanics at 17% of the population, committed 15% of violent crimes in 2018 and 20% in 2019. The white rate declined slightly and the "Other" rate declined dramatically.

In this table, I have calculated the percentages by offender. For instance, 86.8% of the victims of white criminals are fellow whites, 4.5% are black, and 8.6% are Hispanic. Meanwhile, 44.2% of the victims of black criminals are white, 32.4% are fellow blacks, and 23.3% are Hispanic.
It's important to understand that the greater percentage of white victims of blacks offenders compared to black victims of white offenders does not mean that blacks are targeting whites. In a world where offenders were selecting their victims without regard to race, the percentage of victims for all perpetrators would be exactly that victim's percentage of the population. In other words, 62% of the victims of white offenders would be white, 12% would be black, etc. Likewise, 62% of the victims of black offenders would also be white, and 12% would be black, because that's who makes up the population of victims. And these percentages would apply irrespective of differential rates of crimality.
As it happens, the data show the preference* of all offenders for committing violence against members of their own race. As Steve has pointed out, this is good for social peace. But it's not the end of the story.
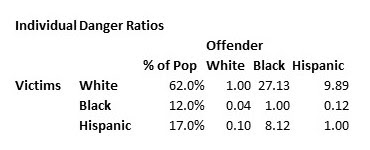
I obtained these ratios by conditioning the interracial crime raw numbers on the offenders percentage of the population, and then taking the ratio. For instance, I divided the number of black-on-white crimes from two slides ago (472,644) by the percentage of blacks in the population (12%). Likewise, I divided the number of white-on-black crimes (90,019) by the percentage of whites in the population (62%). I then divided the first ratio by the second to get what I will call an Individual Danger Ratio of 27.13. This is basically saying that a randomly selected black person is 27 times more likely to commit a crime against a randomly selected white person than that white person is to commit the same crime against the black person.
* Preference, that is, in a model of crime where criminals had criminal access to all races equally. Of course, that's not true: our communities are highly segregated by race, and this data mainly show the criminal preference for committing crimes close to home. To show actual racial preferences in victims, we would need to restrict the interracial crime numbers to people living in the same community, but I'm not sure that data exist.
No comments:
Post a Comment